gc 2553 @8.452s 14%: 0.004+0.33+0.051 ms clock, 0.056+0.12/0.56/0.94+0.61 ms cpu, 4->4->2 MB, 5 MB goal, 12 P
gc 2553 : The 2553 GC runs since the program started @8.452s : Eight seconds since the program started 14% : Fourteen percent of the available CPU so far has been spent in GC
// wall-clock 0.004ms : STW : Write-Barrier - Wait for all Ps to reach a GC safe-point. 0.33ms : Concurrent : Marking 0.051ms : STW : Mark Term - Write Barrier off and clean up.
// CPU time 0.056ms : STW : Write-Barrier 0.12ms : Concurrent : Mark - Assist Time (GC performed in line with allocation) 0.56ms : Concurrent : Mark - Background GC time 0.94ms : Concurrent : Mark - Idle GC time 0.61ms : STW : Mark Term
4MB : Heap memory in-use before the Marking started 4MB : Heap memory in-use after the Marking finished 2MB : Heap memory marked as live after the Marking finished 5MB : Collection goal for heap memory in-use after Marking finished
// Threads 12P : Number of logical processors or threads used to run Goroutines.
清单5显示了最后一个集合的实际数字。多亏了hey,这些是运行的性能结果。
清单6
1 2 3 4 5 6 7 8 9 10
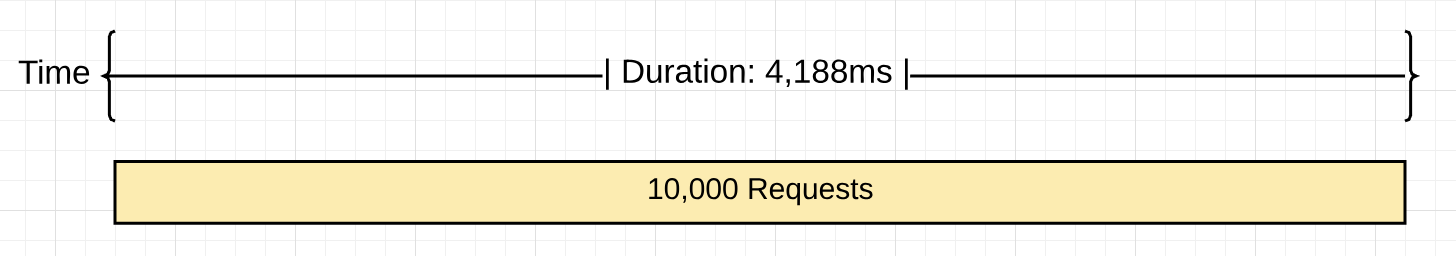
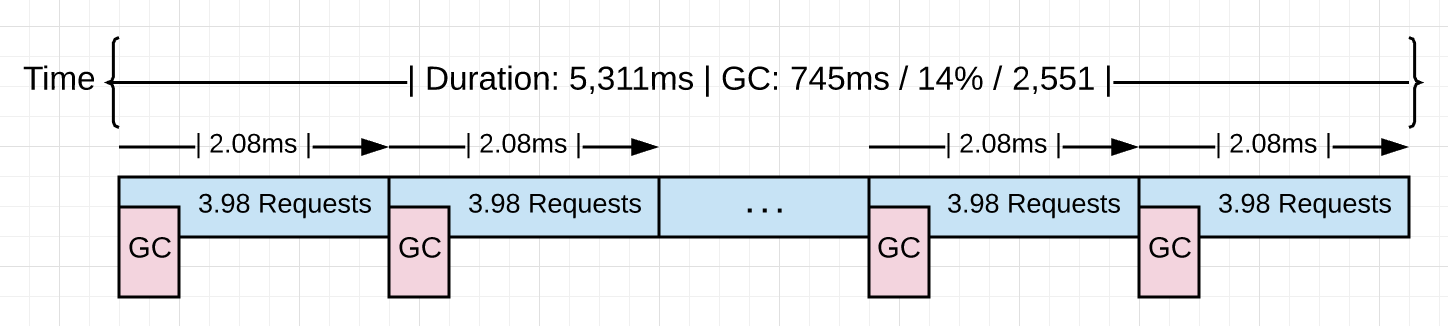
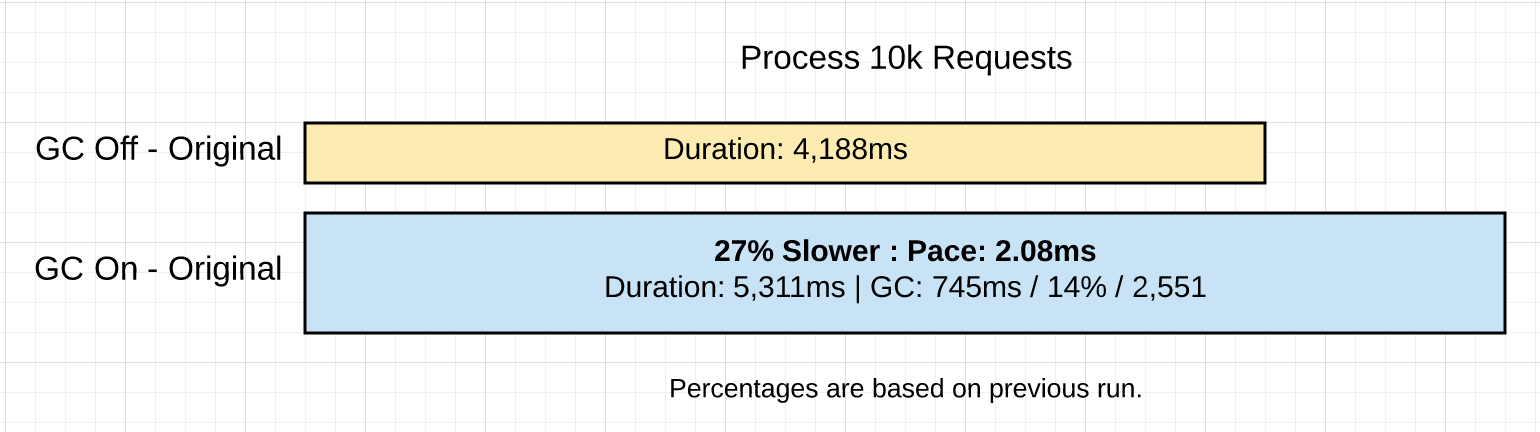
Requests            : 10,000
------------------------------------------------------
Requests/sec        : 1,882 r/s   - Hey
Total Duration      : 5,311ms     - Hey
Percent Time in GC  : 14%         - GC Trace
Total Collections   : 2,551       - GC Trace
------------------------------------------------------
Total GC Duration   : 744.54ms    - (5,311ms * .14)
Average Pace of GC  : ~2.08ms     - (5,311ms / 2,551)
Requests/Collection : ~3.98 r/gc  - (10,000 / 2,511)
(pprof) list rssSearch
Total: 9.56GB
ROUTINE ======================== project/search.rssSearch in project/search/rss.go
   71.53MB     4.55GB (flat, cum) 47.63% of Total


         .          .    117:	// Capture the data we need for our results if we find ...
         .          .    118:	for _, item := range d.Channel.Items {
         .     4.48GB    119:		if strings.Contains(strings.ToLower(item.Description), strings.ToLower(term)) {
   48.53MB    48.53MB    120:			results = append(results, Result{
         .          .    121:				Engine:  engine,
         .          .    122:				Title:   item.Title,
         .          .    123:				Link:    item.Link,
         .          .    124:				Content: item.Description,
         .          .    125:			})
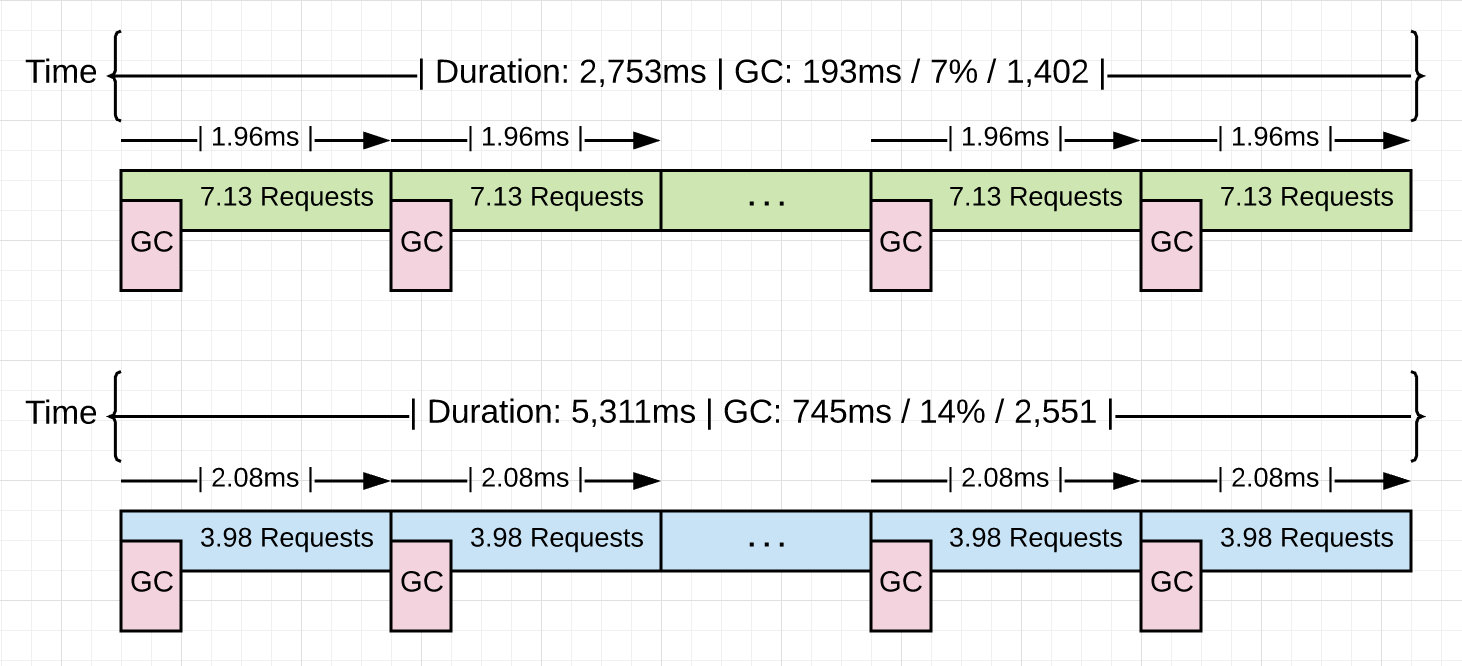
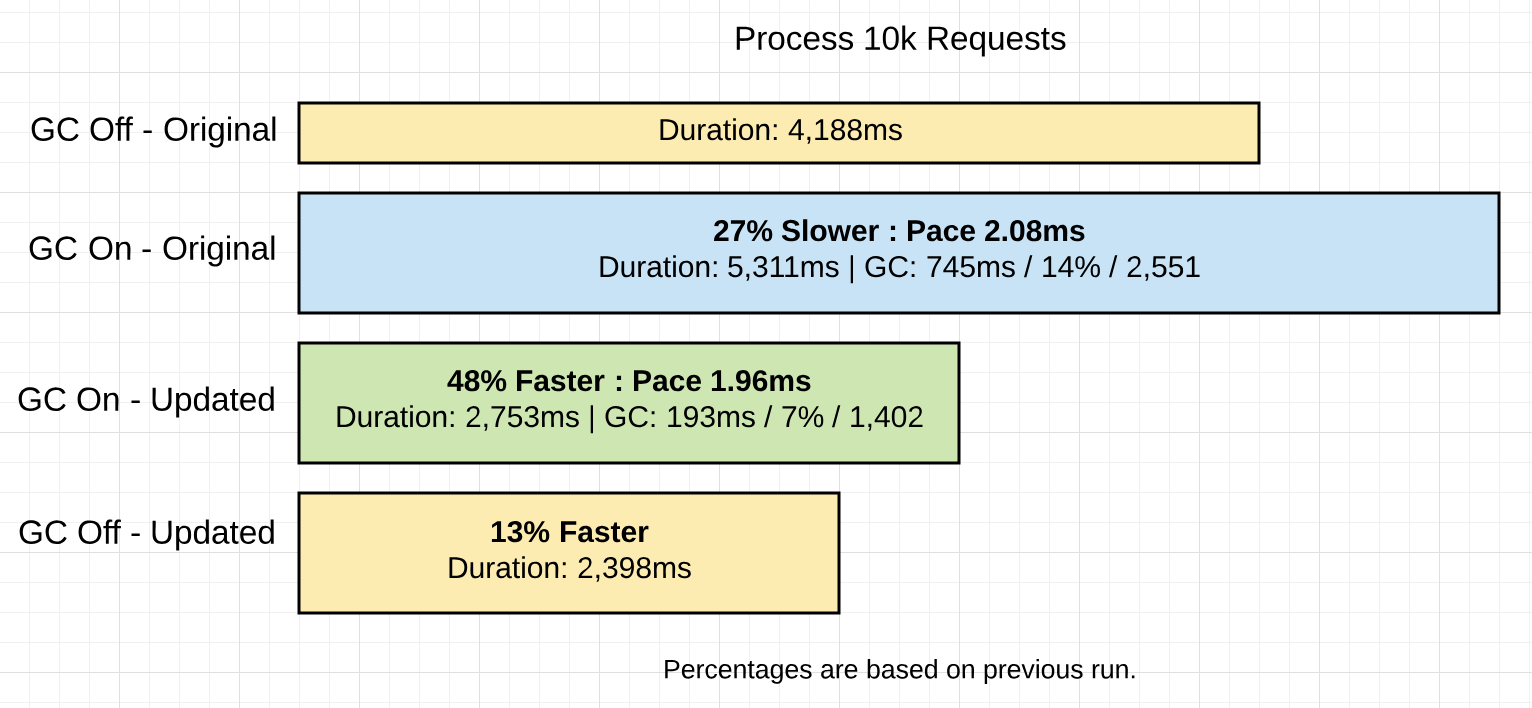
With Extra Allocations              Without Extra Allocations
======================================================================
Requests            : 10,000        Requests            : 10,000
----------------------------------------------------------------------
Requests/sec        : 1,882 r/s     Requests/sec        : 3,631 r/s
Total Duration      : 5,311ms       Total Duration      : 2,753 ms
Percent Time in GC  : 14%           Percent Time in GC  : 7%
Total Collections   : 2,551         Total Collections   : 1,402
----------------------------------------------------------------------
Total GC Duration   : 744.54ms      Total GC Duration   : 192.71 ms
Average Pace of GC  : ~2.08ms       Average Pace of GC  : ~1.96ms
Requests/Collection : ~3.98 r/gc    Requests/Collection : 7.13 r/gc
清单16显示了带有垃圾收集的两个版本应用程序的结果。很明显,删除4.48GB的分配使应用程序运行得更快。有趣的是,每个系列(两个版本)的平均速度几乎相同,约为2.0毫秒。这两个版本之间的根本变化是每个集合之间的工作量。应用范围从3.98 r / gc到7.13 r / gc。这是完成工作量增加79.1%。